Hail and wind damage by state, 2024 and 2025
Signature Roofing Leads: $5 a lead, 50-lead minimum ($250 to start). Roofing Inbound Calls: $150 a call, 5-call minimum ($750 to start), a homeowner with a roof problem already on the line when you answer. How inbound calls work.
Roof demand follows weather, and the federal government counts the weather. These are all 51 states, not a sample, ranked on hail, hail an inch or larger, damaging wind and tornadoes for 2025, with 2024 alongside for comparison, taken from NOAA’s Storm Events Database. The busiest hail months are named for every state that logged hail in 2025, the whole table downloads as CSV or JSON under CC BY 4.0, and the same counts are crossed with each state’s roofing license rules.
The whole table
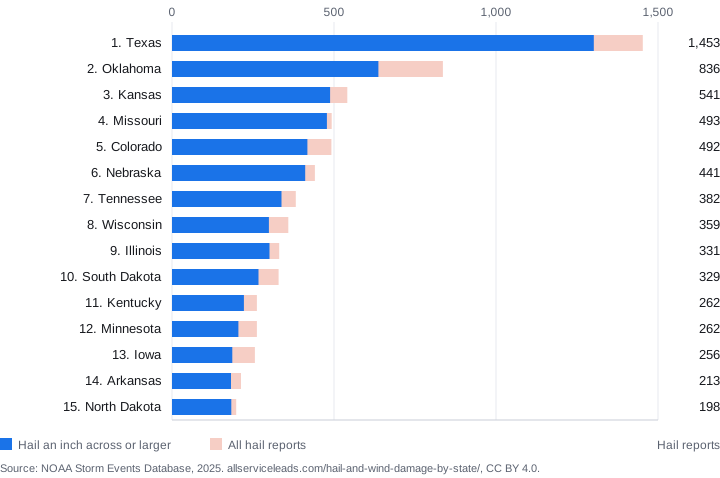
The chart shows the top 15; the table shows all 51, ordered by hail reports in 2025. Click a state for its own page, which carries the same counts with the local detail and whether that state licenses roofing contractors. Chart and table are drawn from one file, so they cannot disagree.
The 15 states with the most hail, charted
| # | State | Hail 2025 | Hail 1 in or larger | Largest hail (in) | Damaging wind | Tornadoes | Peak hail months | Hail 2024 |
|---|---|---|---|---|---|---|---|---|
| 1 | Texas | 1,453 | 1,302 | 6 | 1,674 | 143 | April and May | 1,588 |
| 2 | Oklahoma | 836 | 637 | 4.5 | 799 | 115 | April and May | 765 |
| 3 | Kansas | 541 | 488 | 4 | 1,048 | 32 | April and May | 767 |
| 4 | Missouri | 493 | 478 | 3 | 993 | 114 | March and May | 496 |
| 5 | Colorado | 492 | 418 | 4 | 421 | 26 | June and August | 415 |
| 6 | Nebraska | 441 | 411 | 4 | 668 | 44 | April and July | 510 |
| 7 | Tennessee | 382 | 338 | 3 | 719 | 60 | April and May | 169 |
| 8 | Wisconsin | 359 | 299 | 4 | 324 | 42 | April and May | 225 |
| 9 | Illinois | 331 | 301 | 3 | 1,089 | 141 | March and May | 373 |
| 10 | South Dakota | 329 | 267 | 4.5 | 1,179 | 20 | June and July | 317 |
| 11 | Kentucky | 262 | 222 | 4.5 | 740 | 39 | April and May | 103 |
| 12 | Minnesota | 262 | 205 | 3.25 | 508 | 49 | June and August | 336 |
| 13 | Iowa | 256 | 186 | 4 | 771 | 36 | April and September | 417 |
| 14 | Arkansas | 213 | 182 | 3 | 312 | 67 | April and May | 193 |
| 15 | North Dakota | 198 | 183 | 3.5 | 456 | 91 | June and July | 174 |
| 16 | Montana | 190 | 189 | 3.5 | 623 | 0 | June and July | 96 |
| 17 | Alabama | 184 | 142 | 3.75 | 1,563 | 95 | April and May | 81 |
| 18 | Ohio | 176 | 133 | 3 | 736 | 33 | April and May | 194 |
| 19 | New Mexico | 164 | 131 | 3 | 426 | 15 | May and June | 98 |
| 20 | Georgia | 140 | 122 | 2.5 | 1,026 | 54 | April and May | 104 |
| 21 | Louisiana | 139 | 130 | 2 | 414 | 36 | March and May | 122 |
| 22 | North Carolina | 139 | 113 | 2.5 | 782 | 16 | May and June | 104 |
| 23 | Pennsylvania | 132 | 86 | 2.5 | 1,073 | 23 | April and May | 209 |
| 24 | Indiana | 131 | 100 | 4 | 735 | 61 | March and April | 149 |
| 25 | Mississippi | 131 | 114 | 2.75 | 736 | 114 | March and May | 107 |
| 26 | Wyoming | 106 | 101 | 3 | 594 | 9 | June and July | 59 |
| 27 | West Virginia | 104 | 81 | 2.25 | 807 | 0 | April and May | 49 |
| 28 | New York | 87 | 71 | 2.5 | 960 | 7 | June and July | 54 |
| 29 | Florida | 84 | 66 | 2.5 | 271 | 28 | May and June | 75 |
| 30 | South Carolina | 81 | 59 | 2 | 511 | 9 | April and May | 129 |
| 31 | Virginia | 78 | 69 | 2 | 1,186 | 3 | April and May | 81 |
| 32 | Michigan | 58 | 43 | 2 | 324 | 33 | April and August | 110 |
| 33 | Arizona | 57 | 43 | 2.75 | 188 | 8 | September and November | 31 |
| 34 | Maryland | 50 | 50 | 2.5 | 426 | 7 | May and June | 16 |
| 35 | New Hampshire | 29 | 29 | 1.75 | 53 | 0 | May and June | 35 |
| 36 | Idaho | 17 | 16 | 1.75 | 309 | 2 | May and September | 21 |
| 37 | Massachusetts | 15 | 13 | 1.5 | 220 | 5 | June and September | 36 |
| 38 | Vermont | 12 | 9 | 1.75 | 92 | 0 | May and July | 6 |
| 39 | California | 11 | 5 | 1 | 514 | 4 | March and July | 21 |
| 40 | Nevada | 10 | 7 | 1.5 | 280 | 0 | June and July | 2 |
| 41 | New Jersey | 8 | 5 | 1.75 | 238 | 2 | April and May | 6 |
| 42 | Maine | 6 | 6 | 1.5 | 64 | 0 | July | 15 |
| 43 | Utah | 6 | 5 | 1.25 | 198 | 5 | June and September | 34 |
| 44 | Connecticut | 4 | 4 | 1.75 | 115 | 0 | July and September | 22 |
| 45 | Alaska | 2 | 2 | 1 | 80 | 0 | June and July | 1 |
| 46 | Oregon | 2 | 2 | 1.5 | 45 | 1 | February and August | 9 |
| 47 | Delaware | 1 | 1 | 1.75 | 36 | 2 | May | 0 |
| 48 | Rhode Island | 1 | 1 | 1 | 18 | 0 | July | 8 |
| 49 | District of Columbia | 0 | 0 | — | 13 | 0 | — | 1 |
| 50 | Hawaii | 0 | 0 | — | 7 | 0 | — | 0 |
| 51 | Washington | 0 | 0 | — | 53 | 0 | — | 2 |
Source: NOAA National Centers for Environmental Information, Storm Events Database. Counted from StormEvents_details-ftp_v1.0_d2025_c20260819.csv.gz and StormEvents_details-ftp_v1.0_d2024_c20260728.csv.gz, in NOAA's Storm Events file directory. The one-inch severe-hail threshold is the NOAA Storm Prediction Center's. Compiled September 12, 2026.
Take the whole table: CSV (one row per state per year) or JSON (with the NOAA source files and the column definitions included). Both are generated from the same counts as the table, so they cannot disagree with it. Both are licensed CC BY 4.0: use them anywhere, with credit and a link back to this page, as set out in Cite this data.
Cite this data
Suggested citation, ready to copy:
All Service Leads (2026). Hail, wind and tornado counts by US state, 2024 and 2025. Compiled from the NOAA NCEI Storm Events Database. Licensed CC BY 4.0. https://allserviceleads.com/hail-and-wind-damage-by-state/
You may copy, share and adapt this data for any purpose, commercial use included, as long as you credit All Service Leads, link to this page and to the CC BY 4.0 license, and say if you changed anything.
The license covers this compilation of the counts, not NOAA’s own records, which are US government data and can be downloaded from NOAA directly.
How do I embed this chart?
Paste this snippet into any page. It shows the ranked chart from the top of this page, credits All Service Leads the way CC BY 4.0 asks, and links back here. The image is the same file this page draws, generated from the NOAA counts, so what an embed shows changes when the data does.
<figure style="margin:0;max-width:720px">
  <a href="https://allserviceleads.com/hail-and-wind-damage-by-state/">
    <img src="https://allserviceleads.com/hail-and-wind-damage-by-state/chart.svg"
         alt="The 15 US states with the most hail reports in 2025, from NOAA's Storm Events Database"
         width="720" height="478" style="width:100%;height:auto;border:0">
  </a>
  <figcaption style="font:13px Arial, sans-serif;color:#5b6270">
    Hail and wind damage by state, 2024 and 2025.
    <a href="https://allserviceleads.com/hail-and-wind-damage-by-state/">All Service Leads</a>,
    <a href="https://creativecommons.org/licenses/by/4.0/">CC BY 4.0</a>.
  </figcaption>
</figure>
The chart on its own: /hail-and-wind-damage-by-state/chart.svg, 720 by 478, no script and no web font. Reuse it under CC BY 4.0 with the credit line above, or take the numbers instead from Cite this data.
Which states get the most hail?
Texas, Oklahoma, Kansas, Missouri and Colorado led every state for hail reports in 2025. Those five carry 41% of the 9,203 hail reports NOAA logged across the 51 states that year, and the top ten carry 61%. Hail is not spread evenly, and neither is roof demand.
The concentration is the point. A roofer in Texas works a market where NOAA logged 1,453 hail reports in a single year. The median state logged 106, and Wyoming sits at that midpoint. Both can run a good business, but they are not the same business, and a lead cost that makes sense in one may not in the other.
Counts are reports, not storms and not damaged roofs. One severe afternoon can produce dozens of reports across a metro, and a storm nobody reports does not appear at all. Population and spotter density affect the count, so treat these as a strong signal of where hail happens rather than a census of hailstones.
How much of that hail is big enough to damage a roof?
85% of what gets reported. Of 9,203 hail reports in 2025, 7,865 were an inch across or larger, which is roughly where asphalt shingles start to bruise. Read that share carefully: one inch is also the federal threshold for a severe thunderstorm, so smaller hail is under-reported rather than rare.
That threshold is the National Weather Service's, not ours. The Storm Prediction Center defines a severe thunderstorm as one producing "hail 1 inch in diameter or larger", which is what spotters and warnings are built around, so hail below an inch falls in and out of the record depending on who was watching. The honest reading of the inch-plus column is "confirmed damaging hail happened here", not "85% of all hailstones were an inch".
Ranked on inch-plus hail alone, the order changes: Texas, Oklahoma, Kansas, Missouri and Colorado. A state can log a lot of hail and little of it large, or the reverse, and the second kind is where roofs get replaced.
The largest single stone reported in 2025 was 6 inches, in Texas. For scale, an inch is a quarter, two inches is a hen's egg.
When does hail season actually start?
Earlier than most crews staff for. May is one of the two busiest hail months in 27 of the 51 states, more than any other month, with April next in 19. Hiring and ad budget set in high summer are set after the peak has passed in most of the country.
Each state page on this site names that state’s own peak months wherever it logged enough hail for them to mean something, because the national pattern hides real differences: the Gulf coast and the northern plains do not peak together.
The season is tight. 43 of the 48 states with any hail at all in 2025 peak somewhere in March, April, May or June, which is 90% of them. Ranked by how many states peak in each: May in 27, April in 19, June in 16, July in 13, March in 6. That is the whole argument for staffing against a calendar rather than against last quarter's revenue.
Arizona is the real exception, peaking in September and November on 57 reports. A crew there works a different calendar from the rest of the country, and national advice about spring is wrong for them.
Everywhere else that falls outside the window falls outside it on almost no data: Connecticut (4), Maine (6), Oregon (2), Rhode Island (1). Each logged fewer than 50 hail reports in the year, so the peak-month cell in their row is arithmetic rather than a season. That is why their own state pages name no peak month at all. Do not plan around it, and do not let anyone sell you a lead volume that assumes it.
The practical use is timing rather than trivia. If your market peaks in May, the canvassing crew and the lead spend have to be in place the month before, not the month after.
Which states get the most damaging wind?
Texas, Alabama, Virginia, South Dakota and Illinois led on damaging-wind events in 2025, out of 27,417 across the 51 states. Wind matters to roofers in states hail mostly skips, and it is the reason a low-hail market is not automatically a low-demand market.
NOAA counts thunderstorm wind, high wind and strong wind events together here. Wind damage tends to be more local than hail damage: lifted or missing shingles on the exposed side of a roof rather than a whole slope bruised at once.
Tornadoes are counted separately and are rarer: 1,591 across the 51 states in 2025. They matter enormously to the streets they hit and very little to a market’s overall roof demand.
Did hail get worse between 2024 and 2025?
It moved rather than grew. Hail reports rose in 26 states, fell in 24 and held level in 1 between 2024 and 2025. The largest rise was Tennessee, up 213 reports; the largest fall was Kansas, down 226.
Two years is weather, not climate, and nothing here should be read as a trend. It is useful for a different reason: a market that was quiet last year and busy this year is a market where competitors sized their crews on last year.
District of Columbia, Hawaii and Washington logged no hail at all in 2025, and 8 more logged fewer than ten. In those markets roof work follows wind, rain and age, and buying leads on storm timing makes no sense.
How were these numbers counted?
Straight from NOAA’s own files. We download the Storm Events Database CSVs for 2024 and 2025, count events by state and type, and publish the counts. No modelling, no estimates, no adjustment. The script that does it is in the open, and the source files are named below.
Hail counts every Hail event. The inch-plus column counts hail events with a reported stone diameter of 1.00 inch or more. Wind combines Thunderstorm Wind, High Wind and Strong Wind. Tornado counts tornado events. Peak months are the two months with the most hail reports in that state that year.
The limits are worth stating plainly. NOAA’s database is built from reports, so it undercounts where nobody reports, and it uses the two most recent complete years, so it says nothing about the season you are in. It is still the record an insurance adjuster works from, which is why it is the one we use.
Frequently asked questions
Which state gets the most hail?
Texas, with 1,453 hail reports in 2025, of which 1,302 were an inch across or larger. Oklahoma was second with 836.
What size hail damages a roof?
An inch across is the usual threshold for asphalt shingles, which is why this page counts inch-plus hail separately. Smaller stones can still damage soft metals, vents and older roofs, and an adjuster looks at the roof, not the report.
Where does this data come from?
NOAA’s Storm Events Database, the official United States record of severe weather, for 2024 and 2025. The exact source files are named at the bottom of this page and the counts are computed from them, not typed.
How often is this page updated?
When NOAA publishes another complete year. The database is revised as reports are confirmed, so the counts for a recent year can move slightly after publication.
Does All Service Leads sell leads in every state on this page?
Yes. Signature Roofing Leads are $5 each with a 50-lead minimum and Roofing Inbound Calls are $150 each with a 5-call minimum, ordered by one ZIP code and a radius of 25 to 100 miles, in all 50 states and the District of Columbia.
Where does this leave a roofing contractor?
Storm counts tell you when demand arrives, not what it costs to reach. For that, the price of a lead against your own close rate is the number that decides it, and both are on this site with their working shown.
Buyer guides
Start an order →See your state
Last updated: September 12, 2026. All Service Leads (formerly RoofRoof) is a lead-generation service and does not perform roofing work. We do not guarantee that any lead or call will become a sale. Storm counts are NOAA’s and are reproduced here without adjustment.